#Const SHOW_TICS = False
#If SHOW_TICS Then
Private m_TicPen As Pen
#End If
Private m_CurvePen As Pen
' Return F(X, Y).
Private Function F(ByVal X As Single, ByVal Y As Single) As _
Single
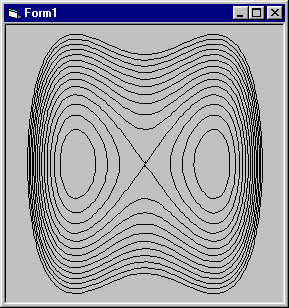
F = X * X * X * X - 2 * X * X + Y * Y
End Function
' Return the partial derivative of dF/dX.
Private Function dFdX(ByVal X As Single, ByVal Y As Single) _
As Single
dFdX = 4 * X * X * X - 4 * X
End Function
' Return the partial derivative of dF/dY.
Private Function dFdY(ByVal X As Single, ByVal Y As Single) _
As Single
dFdY = 2 * Y
End Function
' Find a point on the curve close to this one.
Private Sub FindPointOnCurve(ByRef X As Single, ByRef Y As _
Single, ByVal level As Single, Optional ByVal start_x _
As Single = 0.1, Optional ByVal start_y As Single = _
0.2, Optional ByVal tolerance As Single = 0.01, _
Optional ByVal initial_delta As Single = 0.1)
Dim dZ As Single
Dim dist As Single
Dim delta As Single
Dim F_XY As Single
Dim dx As Single
Dim dy As Single
Dim direction As Integer
' Start at the starting point.
X = start_x
Y = start_y
delta = initial_delta
' Repeat until we have a decent solution.
Do
' See how far off we are.
F_XY = F(X, Y)
dZ = level - F_XY
If Abs(dZ) < tolerance Then Exit Do
' See if we are switching directions.
If Sign(dZ) <> direction Then
' We are switching directions. Decrease delta.
delta = delta / 2
direction = Sign(dZ)
End If
' Get the gradient.
Gradient(X, Y, dx, dy)
If Abs(dx) + Abs(dy) < 0.001 Then Exit Do
' Move in the right direction.
X = X + dx * delta * direction
Y = Y + dy * delta * direction
' Debug.WriteLine(X & ", " & Y)
Loop
End Sub
' Return the gradient at this point.
Private Sub Gradient(ByVal X As Single, ByVal Y As Single, _
ByRef dx As Single, ByRef dy As Single)
Dim dist As Single
dx = dFdX(X, Y)
dy = dFdY(X, Y)
dist = CSng(Sqrt(dx * dx + dy * dy))
If Abs(dist) < 0.0001 Then
dx = 0
dy = 0
Else
dx = dx / dist
dy = dy / dist
End If
End Sub
' Plot the level curve F(X, Y) = level.
Private Sub PlotLevelCurve(ByVal gr As Graphics, ByVal _
level As Single, ByVal xmin As Single, ByVal xmax As _
Single, ByVal ymin As Single, ByVal ymax As Single, _
Optional ByVal step_size As Single = 0.1, Optional _
ByVal start_x As Single = 1.0, Optional ByVal start_y _
As Single = 1.0, Optional ByVal tolerance As Single = _
0.02)
Dim num_points As Integer
Dim X0 As Single
Dim Y0 As Single
Dim X1 As Single
Dim Y1 As Single
Dim X2 As Single
Dim Y2 As Single
Dim dx As Single
Dim dy As Single
' Find a point (X0, Y0) on the level curve.
FindPointOnCurve(X0, Y0, level, start_x, start_y, _
tolerance)
' Start here.
num_points = 1
' Start following the level curve.
X2 = X0
Y2 = Y0
Do
X1 = X2
Y1 = Y2
' Find the next point along the curve.
Gradient(X2, Y2, dx, dy)
If Abs(dx) + Abs(dy) < 0.001 Then Exit Do
X2 += dy * step_size
Y2 -= dx * step_size
FindPointOnCurve(X2, Y2, level, X2, Y2, tolerance)
' Draw to this point.
gr.DrawLine(m_CurvePen, X1, Y1, X2, Y2)
#If SHOW_TICS Then
gr.DrawLine(m_TicPen, _
CSng(X2 - dx * 0.05), CSng(Y2 - dy * 0.05), _
CSng(X2 + dx * 0.05), CSng(Y2 + dy * 0.05))
#End If
num_points = num_points + 1
' See if the point is outside the drawing area.
If X2 < xmin Or X2 > xmax Or _
Y2 < ymin Or Y2 > ymax _
Then Exit Do
' If we have gone at least 4 points, see if this
' is where we started.
If num_points >= 4 Then
If Sqrt((X0 - X2) * (X0 - X2) + (Y0 - Y2) * (Y0 _
- Y2)) <= step_size * 1.1 Then
gr.DrawLine(m_CurvePen, X2, Y2, X0, Y0)
Exit Do
End If
End If
Loop
End Sub
' Draw the level curves.
Private Sub Form1_Load(ByVal sender As System.Object, ByVal _
e As System.EventArgs) Handles MyBase.Load
' Make pens.
m_CurvePen = New Pen(Color.Black, 0)
#If SHOW_TICS Then
m_TicPen = New Pen(Color.Green, 0)
#End If
' Make a Bitmap to draw on.
Dim bm As New Bitmap(picCanvas.ClientSize.Width, _
picCanvas.ClientSize.Height)
Dim gr As Graphics = Graphics.FromImage(bm)
' Define a transformation so the PictureBox covers
' the drawing area -2 <= x <= -2, -2 <= y <= 2.
Const XMIN As Single = -2
Const XMAX As Single = 2
Const YMIN As Single = -2
Const YMAX As Single = 2
gr.ScaleTransform(CSng(bm.Width / (XMAX - XMIN)), _
CSng(bm.Height / (YMAX - YMIN)))
gr.TranslateTransform(-XMIN, -YMIN, _
System.Drawing.Drawing2D.MatrixOrder.Prepend)
' DEBUG: Draw a not quite closed diamond.
'gr.DrawLine(New Pen(Color.Red, 0), -2, 0, 0, 2)
'gr.DrawLine(New Pen(Color.Red, 0), 0, 2, 2, 0)
'gr.DrawLine(New Pen(Color.Red, 0), 2, 0, 0, -2)
'gr.DrawLine(New Pen(Color.Red, 0), 0, -2, -1.75, -0.25)
' Draw the level curves on the Bitmap.
For level As Integer = -3 To 10
PlotLevelCurve(gr, CSng(level / 4), -4, 4, -4, 4, _
0.05, 1, 1, 0.002)
Next level
' Get the second set of curves in the left peak.
For level As Integer = -3 To -1
PlotLevelCurve(gr, CSng(level / 4), -4, 4, -4, 4, _
0.05, -1, 1, 0.002)
Next level
' Display the result.
picCanvas.Image = bm
End Sub
|